Hodrick Prescott Filtering
AlgorithmHodrick-Prescott filtering is a filtering method. A filtering method can be used to find \(x_t\) given \(x_1,\dots,x_t\). In this post we will go through a simple filtering example with Hodrick-Prescott filtering.
However Hodrick-Prescott filtering seems most useful as an offline smoothing method e.g. for finding \(x_t\) given \(x_1,\dots,x_T\) for \(1\leq t\leq T\).
A good article about the related \(l_1\) trend filtering and this filtering method is found in [1].
In Hodrick-Prescott filtering, the trend estimate \(x_t\) is chosen to minimize the objective function:
\[ \begin{aligned} L(x) &= \frac{1}{2}\sum_{t=1}^{n}(y_t - x_t)^2 + \lambda \sum_{t=1}^{n-1}(x_{t-1} - 2x_t + x_{t+1})^2 \\ &= \frac{1}{2}\lVert y - x \rVert_2 ^ 2 + \lambda \lVert Dx \rVert_2 ^ 2 \\ &= \frac{1}{2} (y - x) ^ T (y - x) + \lambda x^TD^TDx \\ &= \frac{1}{2} (y^Ty + x^Tx - 2x^ Ty) + \lambda x^TD^TDx \end{aligned} \]
Where
\[ D = \begin{bmatrix} 1&-2&1\cr &1&-2&1\cr &&\ddots&&\ddots\cr &&&1&-2&1\cr &&&&1&-2&1\cr \end{bmatrix} \]
The second part of the objective function:
\[ \lambda \sum_{t=1}^{n-1}(x_{t-1} - 2x_t + x_{t+1})^2 \]
Is a term penalizing the central difference estimate of the second derivative:
\[ x_{t-1} - 2x_t + x_{t+1} = \frac{\frac{x_{t-1} - x_t}{1} - \frac{x_t - x_{t+1}}{1}}{1} \]
Assuming a constant difference of \(1\) between the observations. If the difference between the observations is a different, but still constant value, \(h\) then
\[ \frac{\frac{x_{t-1} - x_t}{h} - \frac{x_t - x_{t+h}}{h}}{h} = \frac{1}{h^2}(x_{t-1} - 2x_t + x_{t+1}) \]
The \(h\) be factored to the regularization parameter \(\lambda\) e.g.
\[ \begin{aligned} \frac{1}{2}\sum_{t=1}^{n}(y_t - x_t)^2 + \eta \sum_{t=1}^{n-1}(\frac{1}{h^2}(x_{t-1} - 2x_t + x_{t+1}))^2 &= \frac{1}{2}\sum_{t=1}^{n}(y_t - x_t)^2 + \frac{\eta}{h^4} \sum_{t=1}^{n-1}(x_{t-1} - 2x_t + x_{t+1})^2 \\ &= \frac{1}{2}\sum_{t=1}^{n}(y_t - x_t)^2 + \lambda \sum_{t=1}^{n-1}(x_{t-1} - 2x_t + x_{t+1})^2 \end{aligned} \]
If \(\lambda = \frac{\eta}{h^4}\). The right hand side is now the same objective function but wrt. a central difference estimate with constant difference \(h\) between the observations.
The optimal value can be find by setting the derivative to \(0\), because the objective is strictly convex.
\[ \begin{aligned} \frac{\partial}{\partial x} L(x) &= \frac{\partial}{\partial x} (\frac{1}{2} (y^Ty + x^Tx - 2x^ Ty) + \lambda x^TD^TDx) \\ &= \frac{1}{2} \frac{\partial}{\partial x} ( x^Tx - 2x^ Ty) + \lambda \frac{\partial}{\partial x} x^TD^TDx \\ &= \frac{1}{2}( 2 x - 2y) + \lambda 2 D^TDx \\ &= x - y + \lambda 2 D^TDx \\ &= 0 \\ &\Downarrow \\ y &= x + \lambda 2 D^TDx \\ &= (I + \lambda 2 D^TD) x \\ &\Downarrow \\ x &= (I + \lambda 2 D^TD)^{-1}y \end{aligned} \]
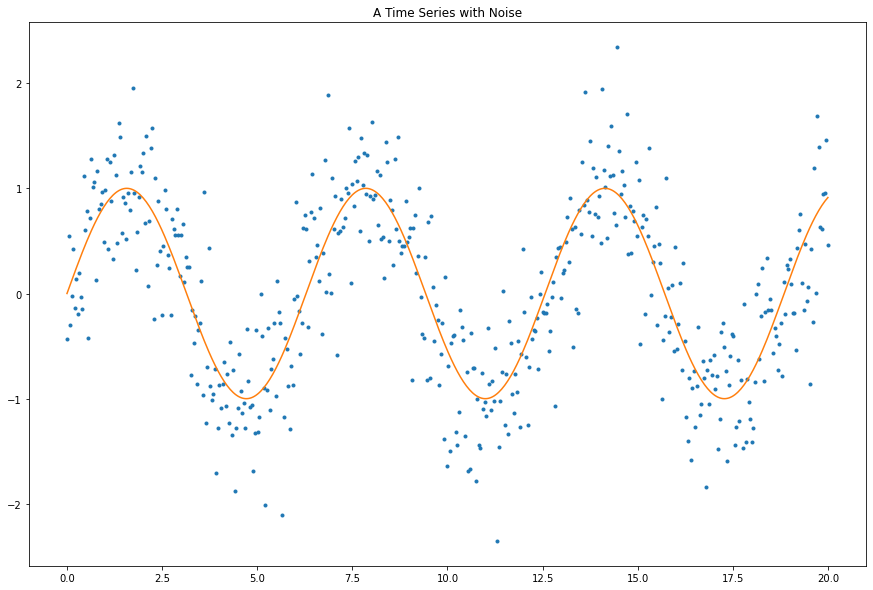
Lets test the filtering method out in a simulation experiment.
import numpy as np
import matplotlib.pyplot as plt

# Standard deviation of the gaussian noise.
EPS = 0.05

# Number of observations
N = 500

# Regularization parameter.
ETA = 0.05

# The size of the interval from [0, B].
B = 20

t = np.linspace(0, B, num=N)
h = np.diff(t)[0]
x = np.sin(t)
eps = np.random.normal(scale=0.5, size=N)
y = x + eps

plt.figure(figsize=(15, 10))
plt.plot(t, y, '.')
plt.plot(t, x, '-')
plt.title("A Time Series with Noise")
plt.show()
Lets start by creating the matrix \(D\).
D = np.zeros((N-2, N))
for i in range(N-2):
    D[i, i:i+3] = [1, -2, 1]
D
array([[ 1., -2., 1., ..., 0., 0., 0.],
[ 0., 1., -2., ..., 0., 0., 0.],
[ 0., 0., 1., ..., 0., 0., 0.],
...,
[ 0., 0., 0., ..., 1., 0., 0.],
[ 0., 0., 0., ..., -2., 1., 0.],
[ 0., 0., 0., ..., 1., -2., 1.]])We can now calculate what we will call the projection matrix \(P = (I + \lambda 2 D^TD)^{-1}\), because it is very similar to the projection matrix in linear regression (probably the same in some sense).
P = np.linalg.inv(np.eye(N) + 2 * ETA / h ** 4 * D.T.dot(D))
P
array([[9.59020654e-02, 9.10718484e-02, 8.62649624e-02, ...,
2.16669024e-12, 2.15885073e-12, 2.15095572e-12],
[9.10718484e-02, 8.67281902e-02, 8.23821818e-02, ...,
2.15001117e-12, 2.15445881e-12, 2.15885073e-12],
[8.62649624e-02, 8.23821818e-02, 7.84971751e-02, ...,
2.13327619e-12, 2.15001117e-12, 2.16669024e-12],
...,
[2.16669024e-12, 2.15001117e-12, 2.13327619e-12, ...,
7.84971751e-02, 8.23821818e-02, 8.62649624e-02],
[2.15885073e-12, 2.15445881e-12, 2.15001117e-12, ...,
8.23821818e-02, 8.67281902e-02, 9.10718484e-02],
[2.15095572e-12, 2.15885073e-12, 2.16669024e-12, ...,
8.62649624e-02, 9.10718484e-02, 9.59020654e-02]])Now we project our observed values to get the smoothed values \(x^{hp}\).
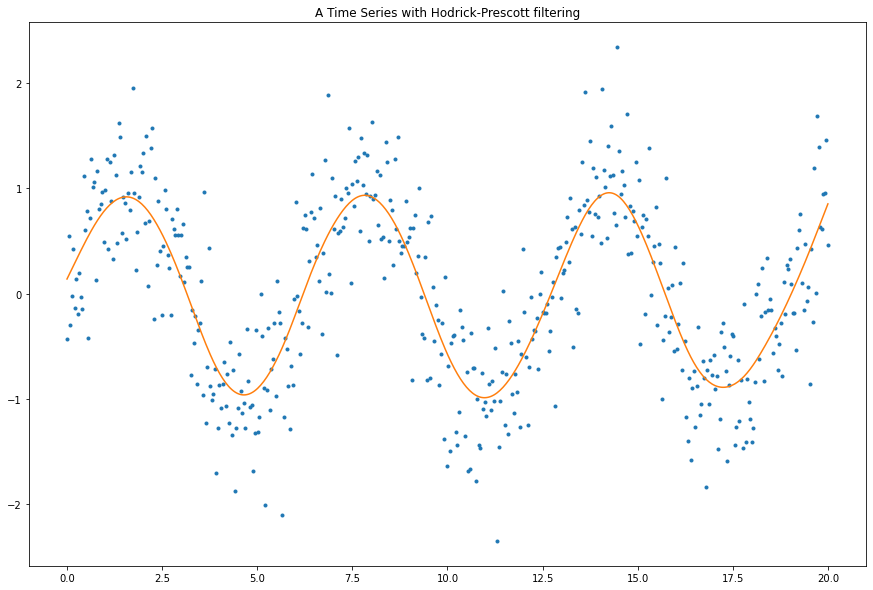
x_hp = P.dot(y)plt.figure(figsize=(15, 10))
plt.plot(t, y, '.')
plt.plot(t, x_hp, '-')
plt.title("A Time Series with Hodrick-Prescott filtering")
plt.show()
As the regularization parameter is increased the line becomes more smooth.
plt.figure(figsize=(20, 15))
for idx, eta in enumerate(np.linspace(0, 0.5, 9)):
    plt.subplot(3, 3, idx + 1)
    P = np.linalg.inv(np.eye(N) + 2 * eta / h ** 4 * D.T.dot(D))
    x_hp = P.dot(y)
    plt.plot(t, y, '.')
    plt.plot(t, x_hp, '-')
    plt.title(f"Lambda: {round(eta, 4)}")
plt.show()
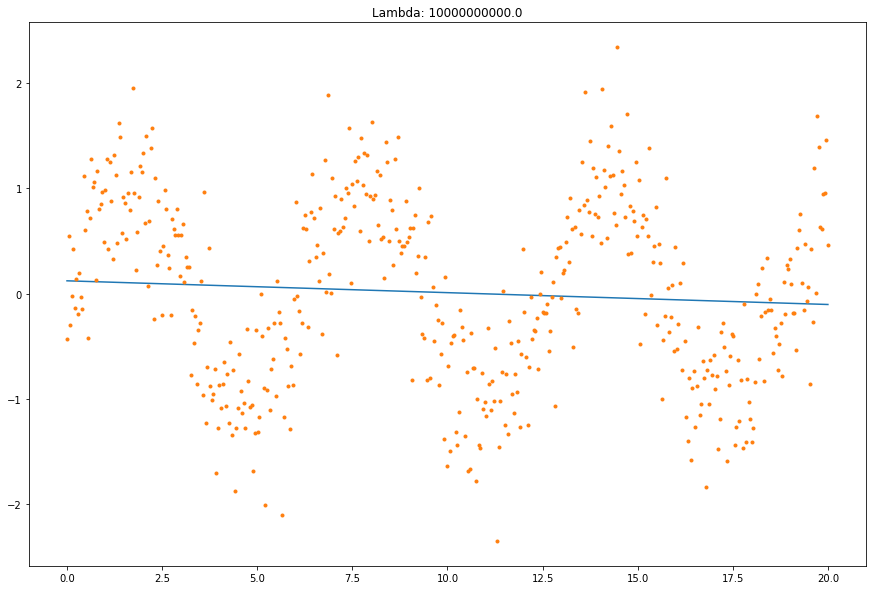
In the limit it is a straight line.
plt.figure(figsize=(15, 10))
P = np.linalg.inv(np.eye(N) + 2 * 1e10 / h ** 4 * D.T.dot(D))
x_hp = P.dot(y)
plt.plot(t, x_hp, '-')
plt.plot(t, y, '.')
plt.title(f"Lambda: {1e10}")
plt.show()
Online Version
Below is my take on an online version of this filtering method.
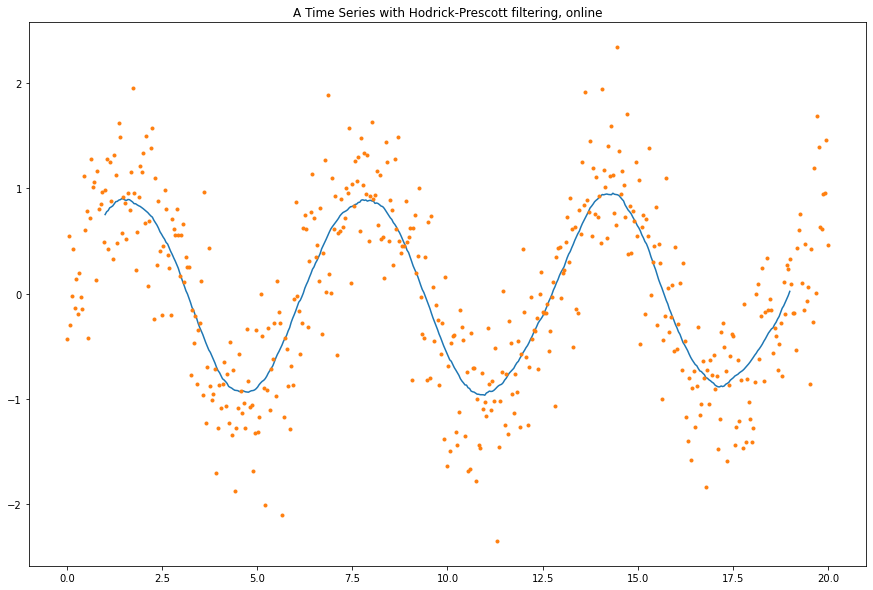
In this online version one fixes the size of the projection matrix and iterativly applies it to a fixed sized fifo queue of the signal \(y\) taking the midpoint in each iteration of the projected values.
# Number of observations
N_ONLINE = 50

# Regularization parameter.
ETA_ONLINE = 0.05
Construct an online version on the projection matrix with a fixed size.
D_online = np.zeros((N_ONLINE-2, N_ONLINE))
for i in range(N_ONLINE-2):
    D_online[i, i:i+3] = [1, -2, 1]
P_online = np.linalg.inv(np.eye(N_ONLINE) + 2 * ETA_ONLINE / h ** 4 * D_online.T.dot(D_online))
Run the projection online and use the midpoint as the filtered value, will result in a shifted time series.
x_hp_online = []
for i in range(N_ONLINE, len(y)):
    x_new = P_online.dot(y[i-N_ONLINE:i])
    x_hp_online.append(x_new[N_ONLINE // 2])
x_hp_online = np.array(x_hp_online)
The result is less smooth.
plt.figure(figsize=(15, 10))
plt.plot(t[N_ONLINE // 2:-N_ONLINE // 2] , x_hp_online, '-')
plt.plot(t, y, '.')
plt.title("A Time Series with Hodrick-Prescott filtering, online")
plt.show()
References
[1] http://www.optimization-online.org/DB_FILE/2007/09/1791.pdf
Comments
Feel free to comment here below. A Github account is required.